Meet aNCA: The End of Complex Non-Compartmental Analysis Workflows

If you're tired of NCA workflows that involve countless steps, handoffs, and weeks of back-and-forth communication, you're in luck - there's finally a better way.
Non-compartmental analysis doesn't have to be this complicated. At Roche, scientists faced exactly this problem - data orders sent to data scientists, external software analysis, multiple file transfers, and vendor-created reports that took far too long to produce. The whole process was unnecessarily fragmented, with constant revisions and clarifications that slowed down critical drug development decisions.
aNCA changes everything by consolidating the entire workflow into a single, user-friendly application. This open-source R Shiny application handles data processing, analysis, and report creation all in one place.
In this article, you'll discover how aNCA transforms complex NCA workflows, explore its powerful features, and learn why pharmaceutical companies are rapidly adopting this solution.
If you have 45 minutes to spare, we recommend you watch aNCA presentation video released only days ago.
Table of contents
- The Problem: A Fragmented and Inefficient Workflow
- What is Non-Compartmental Analysis and Why Does It Matter?
- The aNCA Solution: An Open-Source Approach
- How aNCA Works: From Data Upload to Results
- Real Impact: The New Simplified Workflow
- What's Next for aNCA
- Summing up aNCA
The Problem: A Fragmented and Inefficient Workflow
Before aNCA, the non-compartmental analysis process at Roche was a perfect example of how not to design a workflow. Scientists couldn't just upload their data and get results. Instead, they had to work through a series of handoffs and dependencies between multiple teams.
The process started when scientists created a data order. They specified which variables, parameters, and analytes they needed. This order went to data scientists, who created custom datasets that weren't standardized and varied based on each scientist's specific requirements. The scientists then took this data and ran their NCA analysis on external software.
But that was just the start.
Once the analysis was complete, scientists sent the output files back to the data scientists. The data scientists then created a different version of the results, which they passed along to statisticians. These statisticians had to create standardized ADAM datasets, which were then sent to external vendors who finally created the tables, listings, and graphs (TLGs) needed for the final report.
This wasn't a linear process either. Those arrows between teams went back and forth constantly, with data scientists and scientists trying to figure out what needed to be changed, clarified, or corrected. Each iteration added days or weeks to the timeline.
The result? A process that was unnecessarily complicated, involved too many people, and created bottlenecks at every stage. When you're making critical dosing decisions in drug development, this kind of delay isn't just inconvenient - it can be costly and potentially impact patient outcomes.
What is Non-Compartmental Analysis and Why Does It Matter?
Non-compartmental analysis is a form of pharmacokinetic analysis that answers a fundamental question: what does the body do to a drug? Unlike pharmacodynamics (what the drug does to the body), NCA focuses on how drugs are absorbed, distributed, and eliminated from your system.
The beauty of NCA lies in the fact that you don't need complex assumptions or mathematical models, only observational data and straightforward calculations. This makes it quick, flexible, and essential for regulatory agencies who need reliable data to evaluate new treatments.
Key parameters that drive dose decisions
NCA calculates a couple of critical pharmacokinetic parameters that directly influence how drugs are dosed. Cmax tells you the maximum concentration the drug reaches in the body, while Tmax shows you when that peak occurs. The half-life reveals how quickly the drug is eliminated over time, and clearance measures how efficiently the body removes the drug.
Perhaps the most important parameter is AUC - the area under the curve. This represents total drug exposure and can be calculated through different methods like linear trapezoidal, log trapezoidal, or lin up log down approaches. Scientists also rely on lambda z, the first-order rate constant calculated by fitting the natural logarithm of concentration over time.
These parameters are the foundation for evaluating dose-exposure relationships, which directly determine how much of a drug patients should receive and how often they should take it.
Speed is critical in early development
Speed matters enormously in drug development, especially during early stages when dosing decisions are time-critical. Every day saved in the analysis process can accelerate a drug's path to patients who need it.
Traditional NCA workflows create unnecessary delays precisely when speed is most crucial. When you're trying to determine the right dose for the next phase of clinical trials, waiting weeks for results simply isn't acceptable.
The aNCA Solution: An Open-Source Approach
The Pharmaverse aNCA package represents a collaborative effort between Roche, Appsilon, and Human Predictions to solve the NCA workflow problem once and for all. This open-source tool is designed to make Non-Compartmental Analysis accessible and easy for all scientists, regardless of their coding background.
What makes aNCA special is that it consolidates the entire NCA process into a single R Shiny application. You can upload datasets, perform analysis on pre-clinical and clinical data, visualize results with interactive plots, and export detailed reports all from one interface.
The app lets you customize half-life calculations through rule settings or manual plot adjustments, define AUC intervals of interest, and save analysis settings for future use. Most importantly, it produces standardized PP and ADPP dataset formats that meet regulatory requirements.
Built on the foundation of PKNCA
Under the hood, aNCA relies on PKNCA, an open-source R package that handles all the background calculations. It was shown to be the best open-source option for these specific needs.
PKNCA needs three key inputs to function:
- Concentration data: All the PK samples taken
- Dosing data: When doses were administered and in what quantities
- Intervals: The start and end time of each dosing profile plus which parameters to calculate
These components are combined through a PKNCA data function to create the analysis object, then processed through the PK.NCA function to generate results.
The genius of aNCA is that it takes these technical requirements and presents them through a user-friendly interface. Scientists don't need to understand the underlying PKNCA syntax - they just work with their data through intuitive forms and interactive elements.
Target users and core capabilities
aNCA targets scientists who need to run pharmacokinetic analysis but don't necessarily have extensive coding knowledge. These are the people making dosing decisions based on PK data, and they need results quickly and reliably.
The application handles both clinical and non-clinical datasets with ease. Users can perform manual selections and exclusions for lambda-z regression, visualize results dynamically with customizable graphics, and export PK parameters into comprehensive reports. The interface includes interactive boxplots, summary statistic tables, and scatter plots that make data exploration intuitive and thorough.
How aNCA Works: From Data Upload to Results
The aNCA workflow is refreshingly simple. You start by uploading your dataset in ADNCA format - a standardized CDISC format that combines concentration data, dose data, and interval information into one data frame.
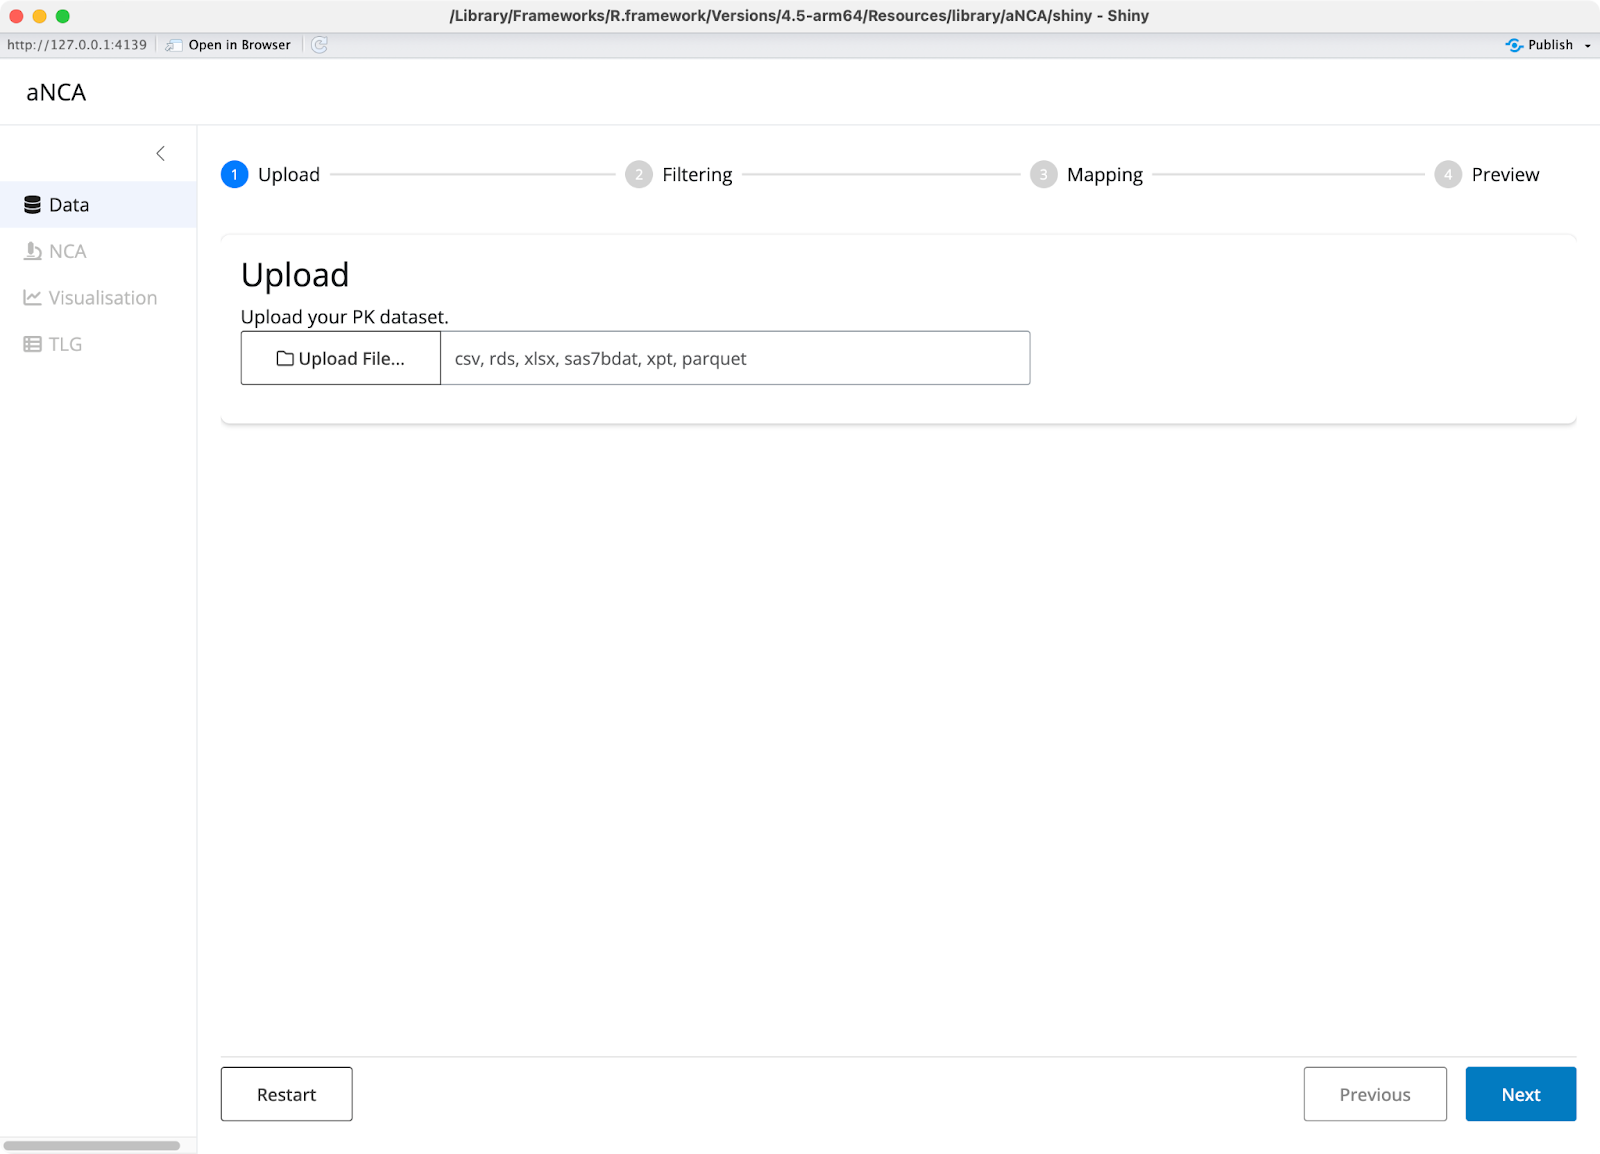
Image 1 - aNCA application start page
The data structure includes a couple of key column types. Concentration records provide the specific analyte values analyzed in the lab, including concentration levels, units, and timing relative to dosing. Dose information covers the dose level given to subjects, route of administration, and specific units.
Once your data is uploaded, you can add filters to focus on specific parts of your dataset. Scientists often need to exclude certain patients for valid scientific reasons, and aNCA provides logical operators to handle these exclusions easily.
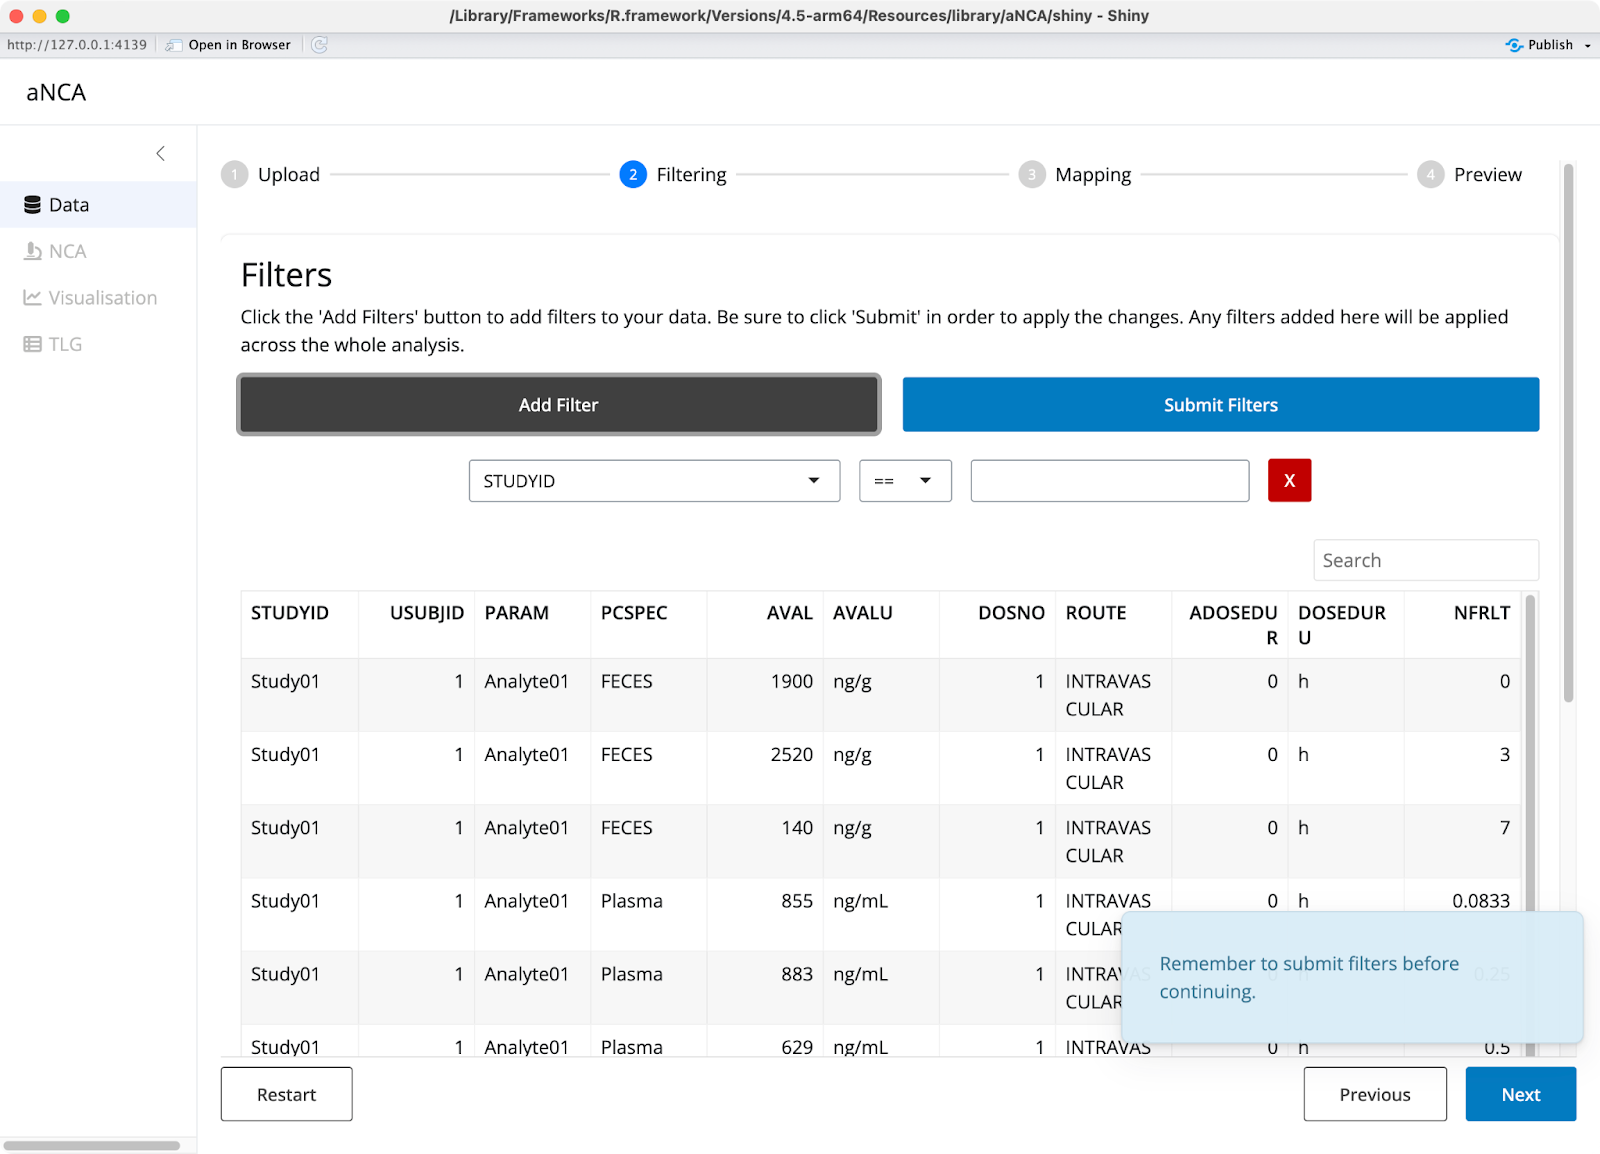
Image 2 - Data filters
The column mapping section lets you transform ADNCA-specific columns to match PKNCA requirements. You can specify how variables should be coded and set dose units manually if needed. The app provides a data review step so you can verify everything looks correct before proceeding.
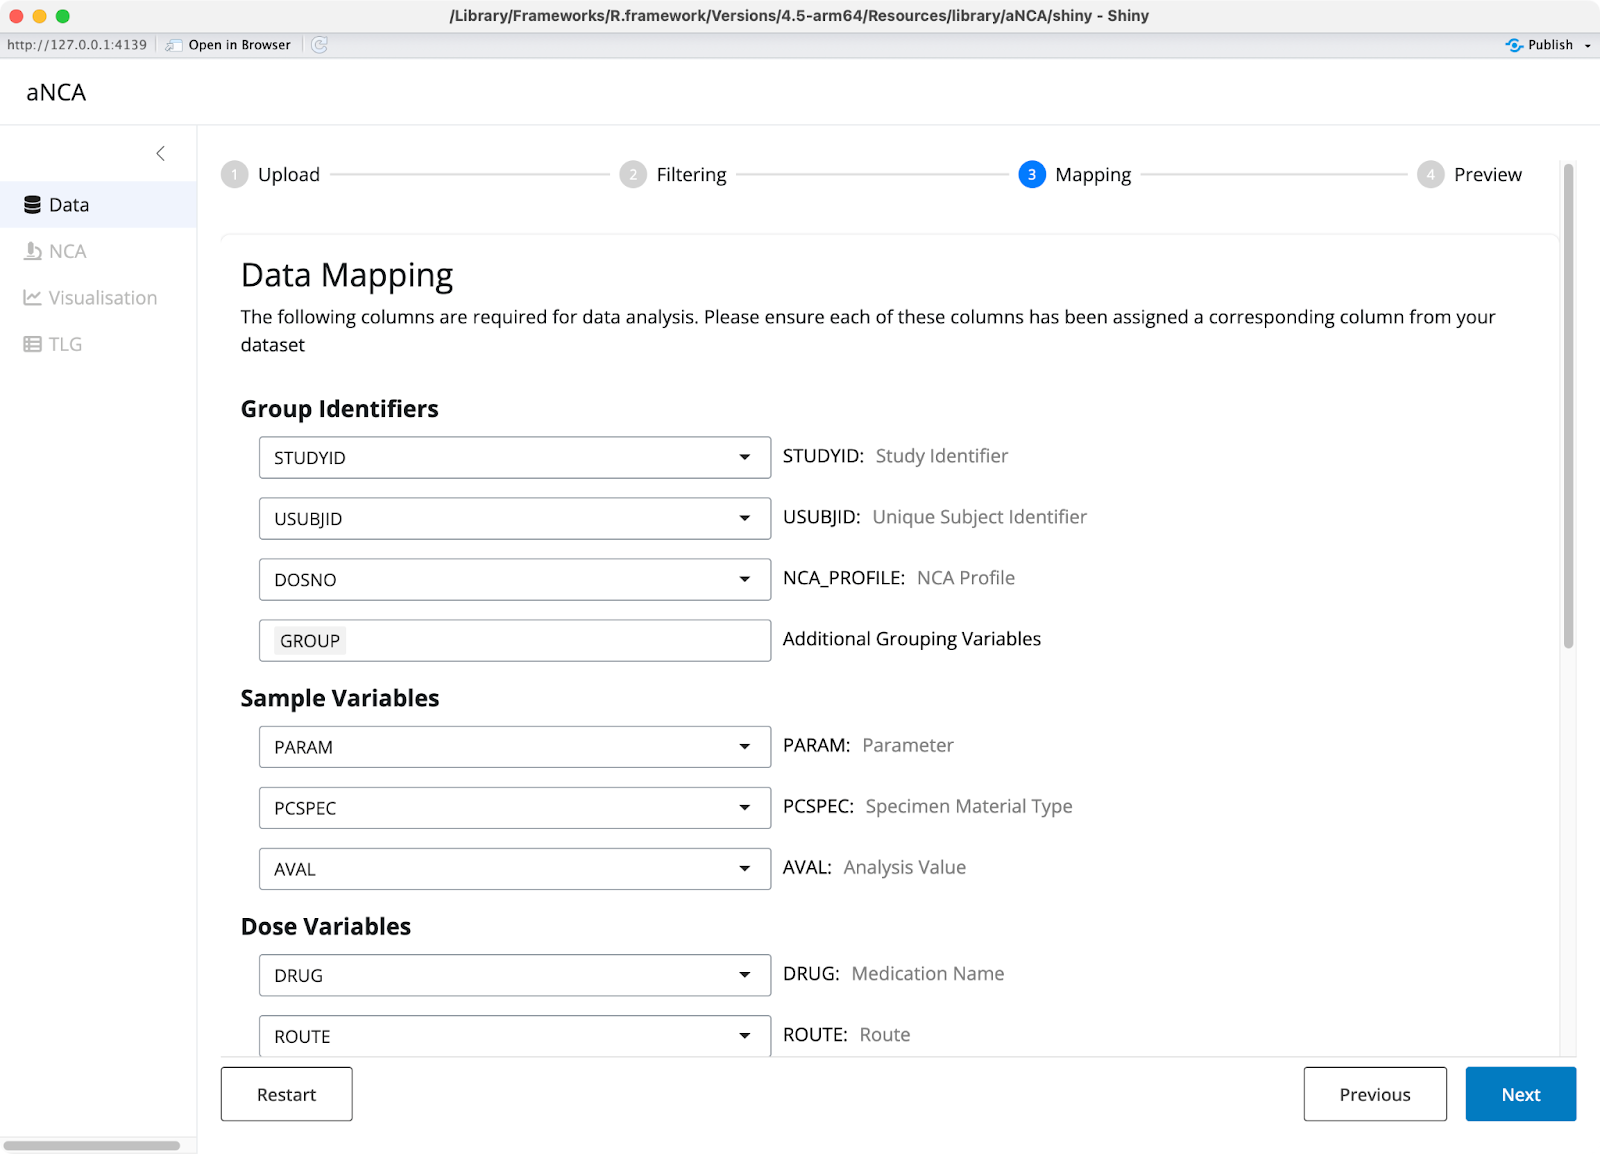
Image 3 - Data mappings
In the NCA settings tab, you specify how to perform your analysis. You choose which analytes to analyze, which dose numbers to include, and which sample specimens to use. The method selection and parameter result units are also configurable - if you want to change units, you simply select the format you want and a conversion factor appears for verification.
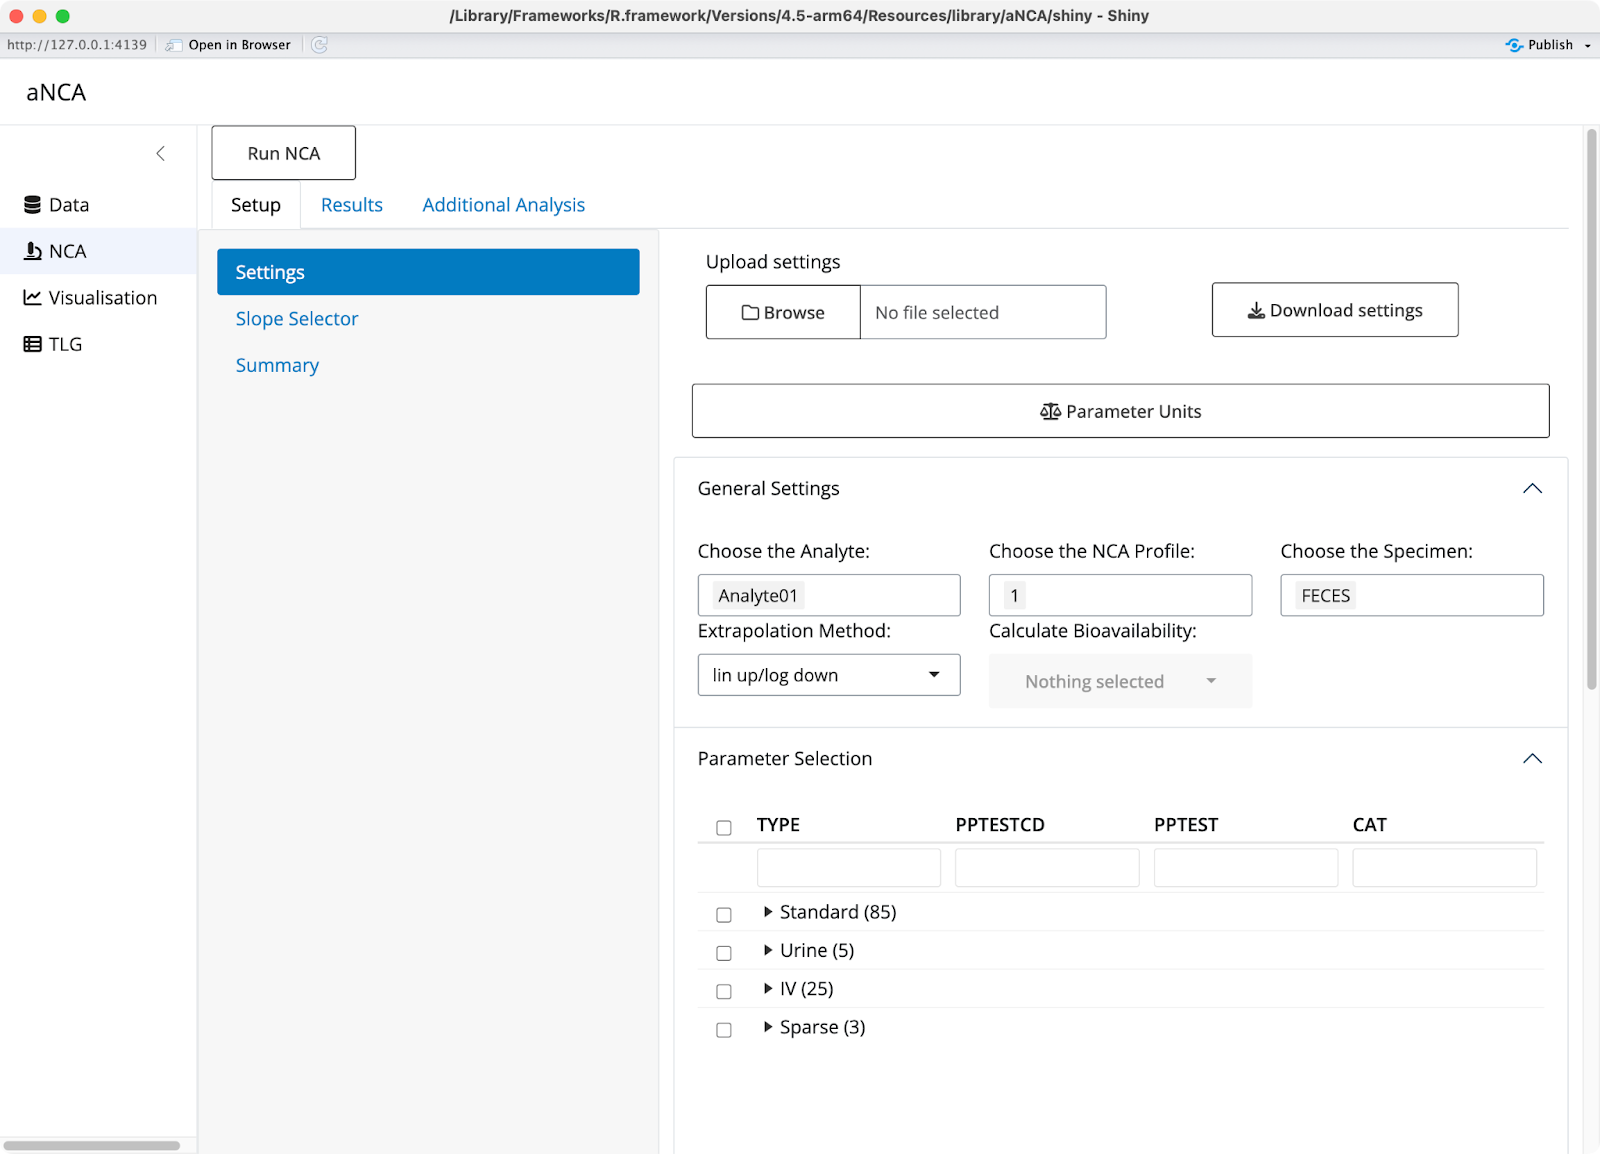
Image 4 - NCA settings tab
Parameter selection is made simple through an interface that accounts for how different programs name these parameters differently. You can choose whether to perform data imputation and specify partial AUC ranges, giving you maximum flexibility in your analysis approach.
After you run your NCA with your specific settings, the app provides clear messages and warnings about any potential issues with your data. Flagged results will appear in different colors - purple rows indicate missing parameters used for flagging, while red rows show parameters that didn't meet your requirements.
The results display all the parameters you requested, with the flexibility to focus on specific ones you want to study. You can explore descriptive statistics across different groups in your data, checking whether factors like patient race or sex influence drug concentration - something scientists always want to explore.
The visualization section offers tools for interactive data exploration. You can create plots where you zoom in on specific areas, switch between linear and log scales, and choose different groupings or analyze by cycle. The interface lets you color-code or select specific groups to compare how different doses perform relative to each other.
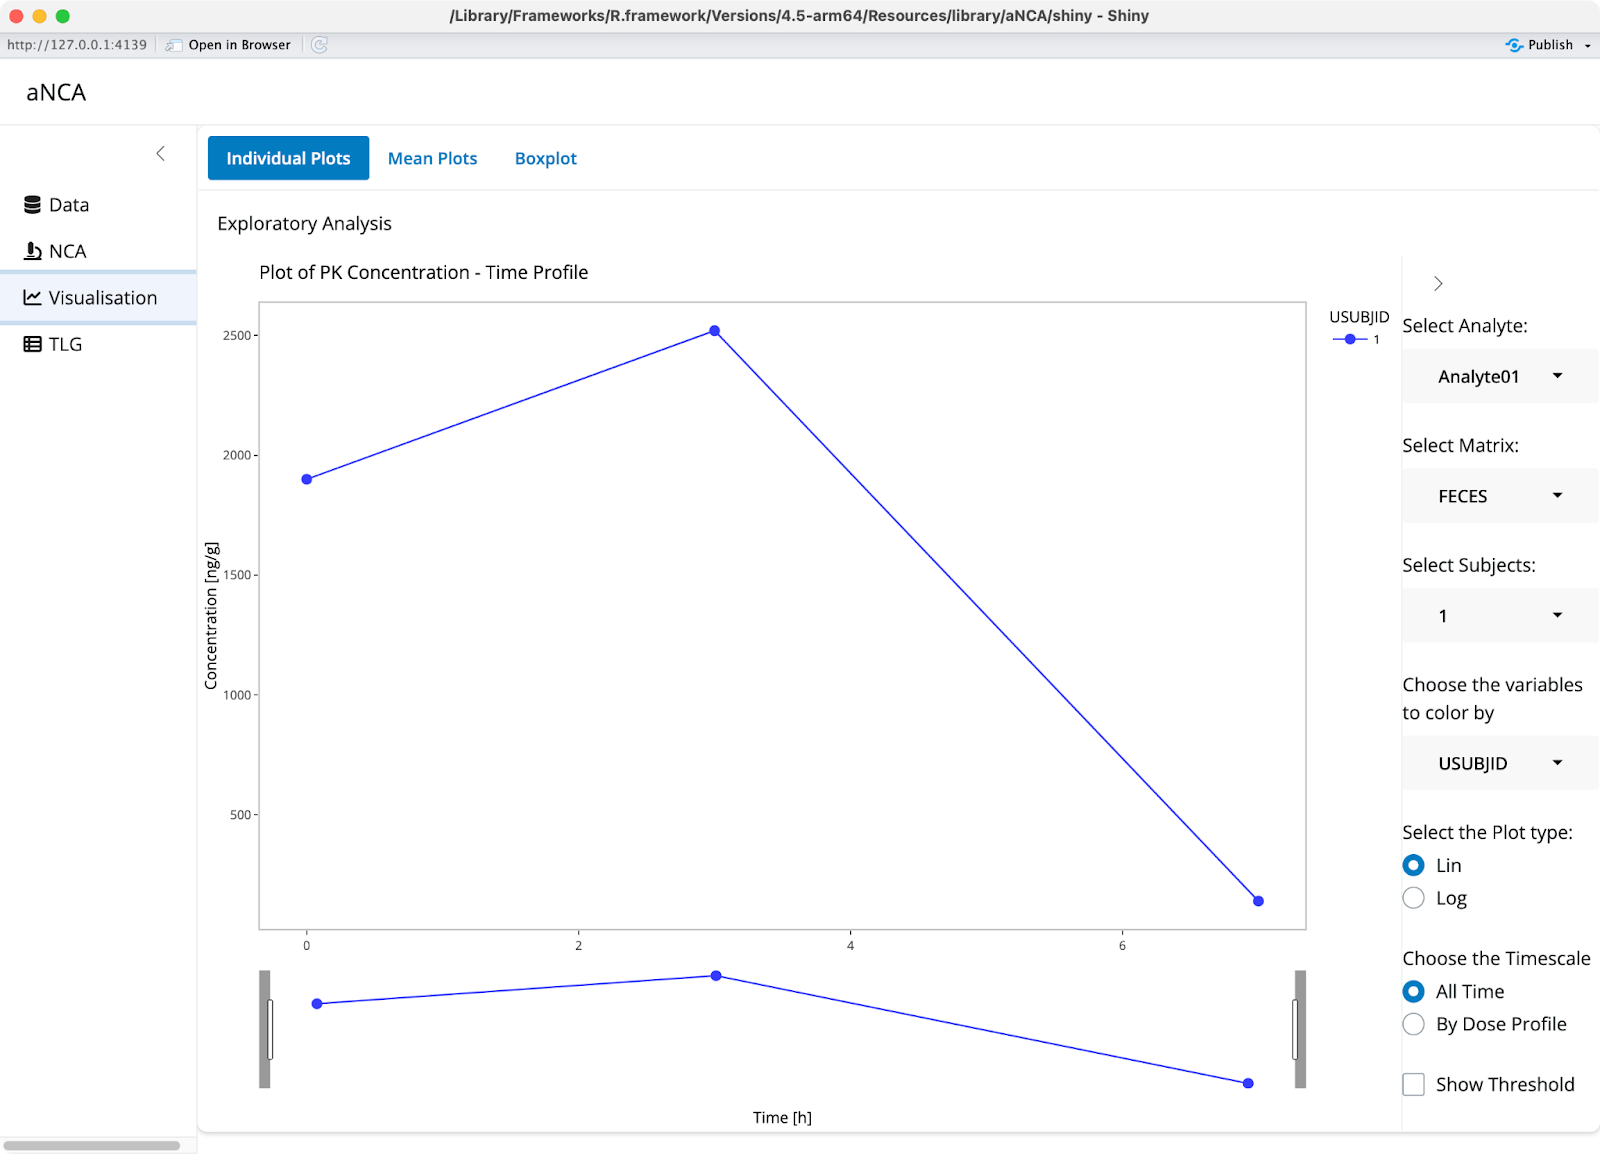
Image 5 - Visualization section
Mean plots show the same concentration data but add options for standard deviation or confidence intervals. Box plots display the calculated PK parameters in an alternative format, while violin plots provide another perspective on data distribution. All plots use plotly, so you can label points and explore specific areas of interest with full interactivity.
Real Impact: The New Simplified Workflow
The transformation from Roche's old workflow to aNCA represents a dramatic simplification that eliminates most of the complexity and delays that plagued the original process.
Now, data scientists create the dataset in standardized ADNCA format without needing a data order from scientists. The aNCA application then handles the NCA analysis, ADAM dataset creation, and TLG generation all in one integrated process. Finally, results can be exported directly to the final report without additional vendor involvement.
This isn't just a minor improvement - it's a complete reimagining of how NCA should work. The constant back-and-forth between teams disappears. The weeks of waiting for external vendors to create tables and graphs becomes unnecessary. Scientists can now control their entire analytical workflow from start to finish.
The validation aspect ensures aNCA meets regulatory requirements. There are systems in place that make validation easier - that’s something Roche is working on right now. In the near future, it’s likely you can expect the entire Shiny app to be validated.
The impact extends beyond just clinical data. Teams are now using aNCA for preclinical datasets, and there are plans to adapt it for toxicology data and oligonucleotide-loaded datasets. What started as a solution for one specific workflow problem has become a versatile platform that different departments can customize for their needs.
At Roche and other pharmaceutical companies, interest in aNCA has grown rapidly across departments. Scientists now have a tool that fits naturally into their research process. The time savings and improved efficiency directly translate to faster drug development timelines and better resource allocation.
What's Next for aNCA
The aNCA development team has ambitious plans to expand the tool's capabilities and reach. The first major goal is full automation of NCA analysis, which means handling multiple studies simultaneously rather than processing one study at a time. In plain English, imagine clicking a single button to run NCA analysis on 20+ studies automatically with default settings - that's the level of efficiency they're working toward.
User experience improvements are also a priority. The team recognizes they built the app organically from small beginnings without initially focusing on optimal UX design. They're now working with dedicated UX designers to refine the front-end interface and make the tool even more intuitive for scientists.
The reporting capabilities will expand significantly with plans to implement the 30 most commonly used TLGs in the pharmaceutical industry. Currently, aNCA covers the basic ones, but the goal is comprehensive coverage of standard industry visualizations. Along with this comes automated report generation in PDF, Word, and potentially PowerPoint formats for presentations.
Beyond traditional NCA, the team plans to add compartmental model analysis and non-linear modeling capabilities. This represents a major expansion beyond the current scope, which offers quick compartmental model analysis for users who need more sophisticated pharmacokinetic modeling options.
The validation process continues as aNCA moves through regulatory approval at Roche and other pharmaceutical companies. Since the tool handles clinical data in regulated environments, thorough validation is essential. The team is also expanding training programs to help scientists learn how to use the app effectively, despite their efforts to make it as user-friendly as possible.
Data format support will broaden beyond the current ADNCA requirement. While parallel work continues on data creation tools, the goal is to make aNCA accessible to users with different data formats and structures.
The collaborative aspect of the project continues to grow, with more contributors joining from various pharmaceutical companies and software development organizations. This open-source approach means improvements and new features benefit the entire drug development community rather than just individual companies.
Summing up aNCA
aNCA by Pharmaverse represents a fundamental shift in how pharmaceutical companies approach non-compartmental analysis. What once required multiple teams, external vendors, and weeks of coordination now happens in a single, integrated application that scientists can control themselves.
Scientists without coding backgrounds can upload their data, configure their analysis, and generate regulatory-compliant reports through an intuitive interface. Meanwhile, the underlying architecture provides the flexibility and reliability that pharmaceutical companies demand for critical drug development decisions.
The collaborative development between Roche, Appsilon, and Human Predictions demonstrates the value of open-source approaches in pharmaceutical software. aNCA creates a shared platform that benefits the entire industry, rather than each company building isolated solutions.
As aNCA continues to evolve with new features, expanded automation, and broader data format support, it's positioned to become an essential tool for pharmacokinetic analysis across the pharmaceutical industry. The combination of validated results, streamlined workflows, and active community development makes it a compelling alternative to traditional NCA approaches.
Ready to explore more about R Shiny in clinical trials? Download our comprehensive guide: Shiny in Clinical Trials: Advanced Development Strategies to discover how pharmaceutical companies are leveraging Shiny applications for regulatory submissions and clinical research.
