Transform Clinical Trials with R and R Shiny (Part 3/3): How to Speed Up Clinical Trials and What to Watch Out For

You don't have to wait months for clinical trial data to become actionable insights - especially when a proven roadmap exists to accelerate decision-making.
The gap between having clinical data and acting on it costs pharmaceutical companies millions in delayed approvals and missed market opportunities. Interactive R and Shiny applications eliminate this bottleneck. They transform static reports into dynamic dashboards that deliver insights during meetings, not weeks later. Major pharmaceutical companies report 30% faster identification of futile trials and 15-20% shorter development timelines when they implement these solutions correctly.
The technology is proven and regulatory acceptance is established. What's missing is a clear implementation roadmap that gets your organization from traditional analytics to interactive decision-making.
In this article, you'll discover exactly how to plan, build, and scale an R and Shiny analytics program that transforms your clinical development process within 90 days.
Learn how GSK trained 1000 biostatisticians in R and began their open-source journey.
Table of contents
- Getting Started: Where to Begin Depending on Your Goals
- Modular Framework: Reuse, Version Control, and UI Consistency
- Agile Team Setup and Better Collaboration Patterns
- Managing Resistance: Skills Gap, Validation, and Process Changes
- Common Pitfalls and Critical Success Factors
- AI Integration: Short-term to Long-term Opportunities
- The 90-day Roadmap: From Pilot to Adoption
Get Started: Where to Begin Based on Your Goals
The key to successful R and Shiny implementation isn't to start with the most complex use case - it's to identify where your organization faces the biggest bottlenecks and start there.
Start simple, then iterate. This principle comes directly from organizations that have successfully implemented R and Shiny across their clinical development programs. The most effective approach focuses on high-value, low-risk applications that can demonstrate clear ROI quickly.
If your organization lacks infrastructure, don't let that stop you. Shiny itself is open source, so you don't need intense, complex infrastructure to start. You can begin with simple concepts and scale as you learn what your actual needs are and what your users require.
The most successful implementations start with pilot project selection criteria that prioritize business impact over technical complexity. Look for use cases where your teams currently experience major delays - safety signal detection that takes weeks instead of days, ad-hoc analysis requests that create 2-3 week backlogs, or go/no-go decisions that stretch across 30-45 days when they should take 7-10 days.
Executive sponsorship matters more than perfect technical readiness. Organizations that secure leadership support early can navigate infrastructure limitations, skills gaps, and process changes more effectively than those with perfect technical setups but limited organizational buy-in.
Your first application should run in parallel with traditional methods without disrupting current workflows. This parallel approach lets you prove value while you maintain operational continuity.
Don't aim for enterprise-wide transformation on day one.
Focus on one specific use case where you can deliver measurable improvement within 30-60 days. Success with your first implementation creates the credibility and momentum needed for broader adoption across your clinical development portfolio.
Modular Framework: Reuse, Version Control, and UI Consistency
The foundation of successful R and Shiny implementation lies in creating a modular clinical application framework that eliminates redundant development and ensures consistency across studies.
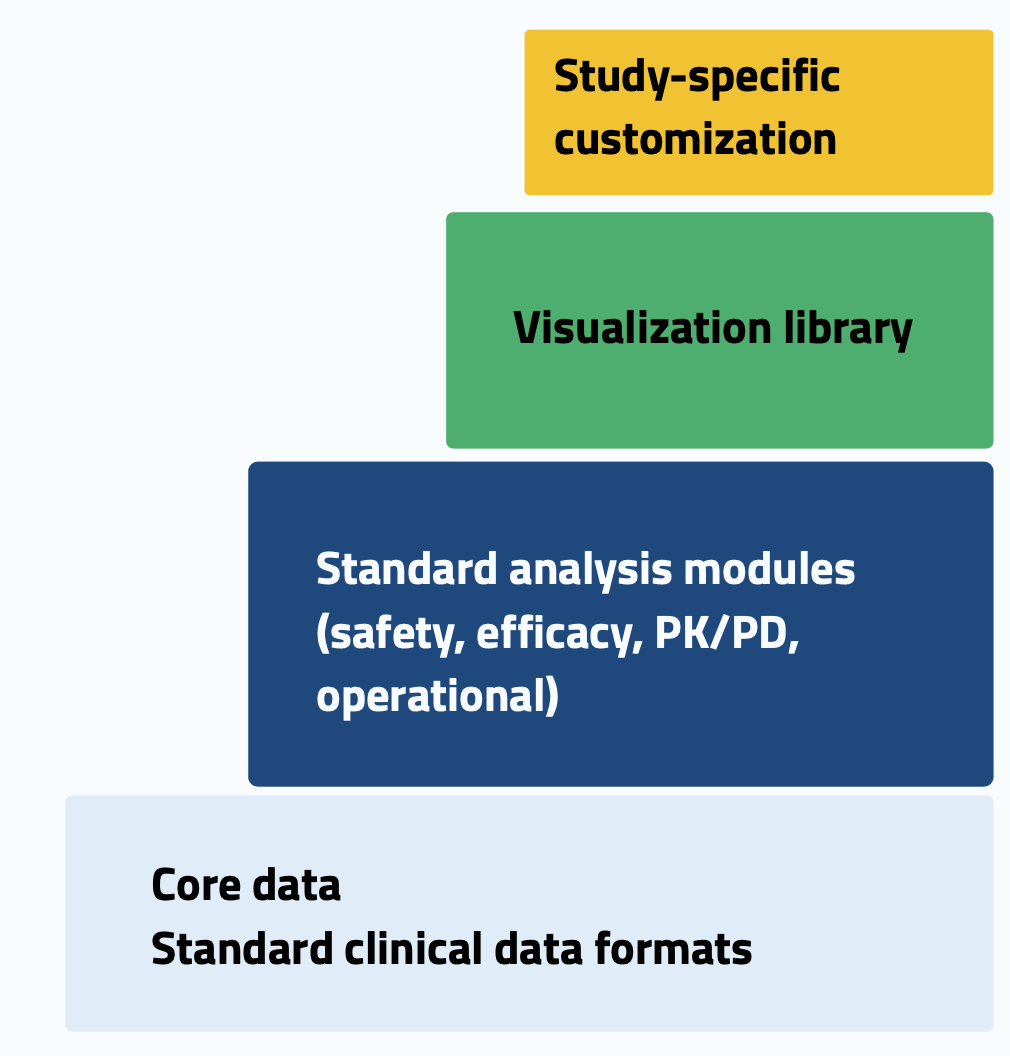
Think layers, not individual applications. The most effective approach uses a four-layer architecture: core data in standard clinical formats, standard analysis modules for safety, efficacy, PK/PD, and operational analytics, visualization library that ensures consistency, and study-specific customization at the top.
This modular approach delivers compelling reuse metrics: 80% of code becomes reusable across studies, new study implementation drops from 2-3 months to 2-3 weeks, validation effort decreases by 70% through pre-validated components, and you achieve 90% user interface consistency across applications.
Version control strategy becomes critical when you're creating reusable components. You need GitHub or GitLab integration with clear branch strategy, code review processes, and continuous integration tests. The workflow should follow: code commit → automated tests → build → validation → approval → deployment.
UI consistency isn't just about aesthetics - it's about operational efficiency. When you're working with multiple studies simultaneously across different phases and therapeutic areas, consistent interfaces prevent teams from having to relearn applications for each new study.
Start to create your framework with the components you need most frequently. Focus on the analysis types that appear in 70-80% of your studies, then expand the library as you encounter new requirements.
Agile Team Setup and Better Collaboration Patterns
The shift to interactive R and Shiny analytics fundamentally changes how clinical teams collaborate - and this transformation delivers measurable improvements in both speed and quality.
The biggest change is to move from linear, document-centered processes to circular, conversation-centered approaches. Traditional workflows create slow feedback cycles where teams request analyses, wait for results, review static reports, and then request modifications. Interactive analytics enable rapid feedback loops where teams can explore data and iterate on results during the same meeting.
The metrics on collaboration effectiveness are compelling: 65% reduction in communication cycles, 40% improvement in first-time quality of analyses, 85% of clinical questions answered within the same day, 3x increase in exploratory analyses with the same resources, and 70% reduction in rework cycles.
Cross-functional teams become essential for success. You need data science capabilities, programming expertise, and project management skills, but more importantly, you need people who can collaborate effectively and exchange insights.
Average time to insight resolution drops from 10 days to 2 days when teams adopt these collaborative patterns. This acceleration happens because interactive dashboards eliminate the back-and-forth requests that traditionally consume weeks of development time.
Communication patterns shift from sequential handoffs between departments to concurrent problem-solving within cross-functional teams. Instead of clinical scientists requesting analyses from statistical programming teams and waiting for results, integrated teams can explore questions together in real-time.
Manage Resistance: Skills Gap, Validation, and Process Changes
Change is never easy, and R and Shiny implementation faces predictable resistance points that successful organizations learn to address proactively.
The five most common resistance points are regulatory concerns, technical skills gaps, process disruption, statistical consistency questions, and IT infrastructure limitations. Each of these challenges has proven mitigation strategies.
Regulatory concerns often top the list, but R-based submissions have already been successfully accepted by the FDA. The open-source collaboration across major pharmaceutical companies ensures that validation efforts are shared industry-wide.
Technical skills gaps require systematic approaches. The transition requires investment in training and community creation across teams. Successful implementations combine formal training programs with mentorship and hands-on project experience.
Process disruption concerns are valid because interactive analytics do change how teams work. The key mitigation strategy is to run parallel approaches with traditional methods rather than attempt immediate wholesale replacement.
IT infrastructure limitations often seem insurmountable but are frequently overstated. Shiny is open source and doesn't require intense infrastructure to begin creation of applications.
Lessons learned from successful implementations emphasize six critical strategies: Start with high-value, low-risk applications. Secure executive sponsorship early. Invest in thorough validation for first projects. Create communities of practice across teams. Celebrate and publicize early wins. Address skepticism with concrete data rather than theoretical benefits.
Common Pitfalls and Critical Success Factors
Learning from organizations that have successfully implemented R and Shiny reveals clear patterns of what to avoid and what to prioritize for successful transformation.
The five most common pitfalls are to start too complex, skip validation, provide insufficient training, have poor data pipeline architecture, and neglect user experience.
Starting too complex is the most frequent error. Organizations often choose their most challenging analytical problem as the first use case, thinking it will demonstrate maximum value. Instead, this creates unnecessary technical hurdles and extends timelines beyond what stakeholders will tolerate.
Skipping validation creates regulatory and quality risks that can undermine entire programs. Even though you're moving faster, validation remains critical to maintain compliance and ensure analytical accuracy.
Insufficient training undermines adoption regardless of how good your applications are. Teams need both technical R and Shiny training and education on new collaborative workflows.
Poor data pipeline architecture creates bottlenecks that limit scalability. The data pipeline needs to support real-time or near-real-time updates that interactive analytics require.
Neglecting user experience kills adoption even when the underlying analytics are sound. Design interfaces that match how clinical teams actually work rather than how developers think they should work.
The four critical success factors are executive sponsorship, cross-functional teams, robust technical infrastructure, and clear success metrics. Executive sponsorship provides organizational support needed to navigate challenges. Cross-functional teams ensure implementations address real business needs. Robust technical infrastructure supports scalability. Clear success metrics demonstrate value and justify continued investment.
AI Integration: Short-term to Long-term Opportunities
The integration of AI with R and Shiny creates a compelling roadmap that builds on the foundation you're establishing today with standards, automation, workflows, and collaboration processes.
Short-term opportunities focus on immediate productivity gains. Predictive enrollment and risk models can help you anticipate recruitment challenges. Automated document and code generation reduces manual effort for routine analytical tasks. Image measurement assistance can accelerate biomarker analysis and reduce variability.
Mid-term applications tackle more complex analytical challenges. Protocol optimization engines can help you design more efficient trials by analyzing historical data. Adaptive trial design support becomes more sophisticated, with AI helping to model complex scenarios and recommend real-time modifications. Multimodal data integration allows you to combine clinical, genomic, imaging, and real-world evidence sources.
Long-term possibilities transform how clinical development works. Digital twin simulations for trial outcomes could allow you to test interventions and predict results before you enroll patients. Automated evidence generation might eliminate much of the manual work involved in regulatory submissions. Clinical decision support systems could provide real-time recommendations during patient care.
The foundation you're creating today with R and Shiny positions you to embrace these AI capabilities as they mature. The standards-based approach, metadata management, and automated workflows you implement now create the infrastructure that AI applications require.
AI integration isn't about replacing your R and Shiny capabilities - it's about amplifying them. Organizations that establish strong R and Shiny foundations will be best positioned to leverage AI capabilities as they become available and proven in clinical development contexts.
The 90-day Roadmap: From Pilot to Adoption
A practical 90-day implementation roadmap can deliver value quickly while you create the foundation for comprehensive transformation across your clinical development program.
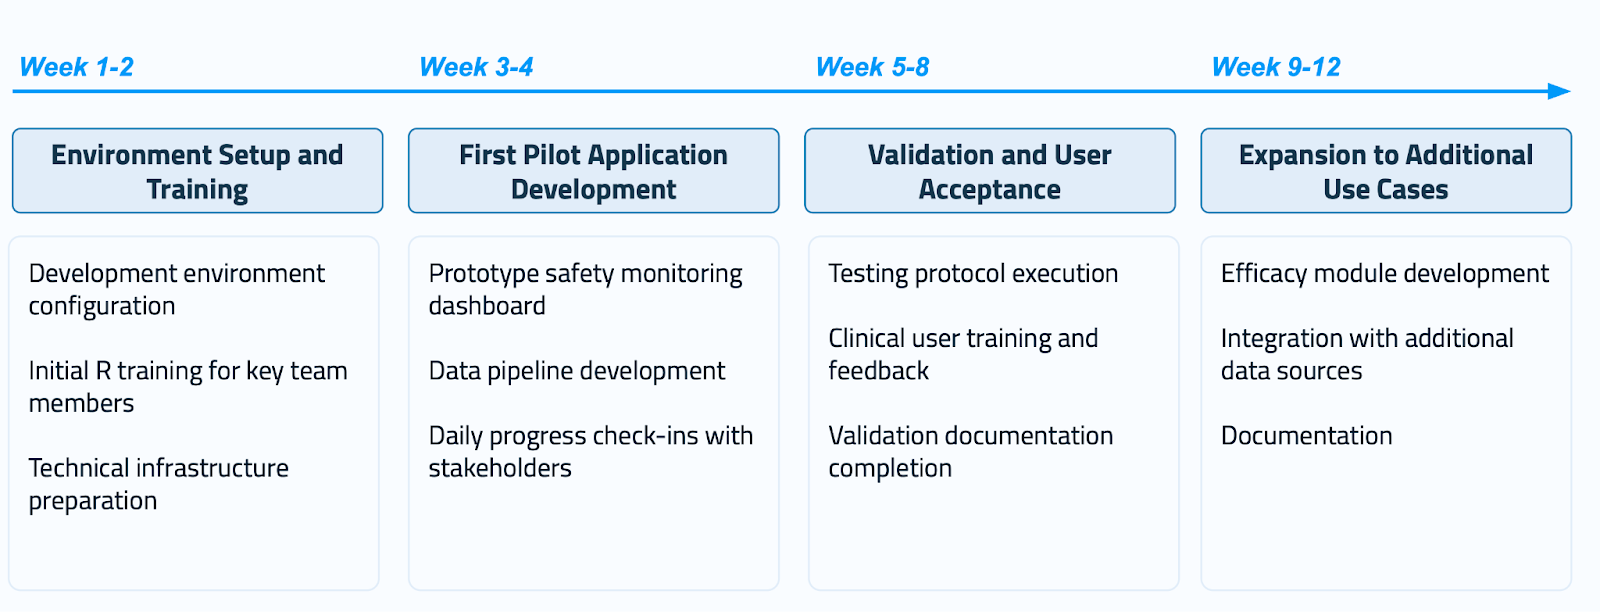
Week 1-2: Environment Setup and Training. Focus on development environment configuration, initial R training for key team members, and technical infrastructure preparation.
Week 3-4: First Pilot Application Development. Create a prototype safety monitoring dashboard with data pipeline development and daily progress check-ins with stakeholders. Choose safety monitoring because it delivers immediate, visible value.
Week 5-8: Validation and User Acceptance. Execute test protocols, provide clinical user training and feedback sessions, and complete validation documentation. This phase proves that your application meets regulatory standards while you create user confidence.
Week 9-12: Expansion to Additional Use Cases. Develop efficacy modules, integrate additional data sources, and create comprehensive documentation. By this point, you've proven the concept and can expand to broader applications.
This phased approach demonstrates value at each milestone. After the first month, you have concrete results to show stakeholders. By month two, you have validated applications that meet compliance requirements. By month three, you're scaling to multiple use cases based on proven success.
The roadmap includes built-in learning opportunities. Each phase generates insights about your organization's specific needs, user preferences, and technical requirements that inform subsequent development.
Success depends on maintaining momentum through early wins while you create sustainable capabilities for long-term adoption. The 90-day timeline creates urgency that drives decision-making and resource allocation, while the phased structure ensures you're building on solid foundations.
Start simple, validate thoroughly, and expand systematically. This approach has proven effective across multiple organizations and therapeutic areas. It delivers measurable business impact within three months while you establish the infrastructure needed for enterprise-wide transformation.
Ready to accelerate your clinical trial analytics transformation? Download our comprehensive implementation guide for detailed strategies, case studies, and technical resources.
For the latest insights on pharmaceutical analytics and AI integration, subscribe to our Pharma Brief newsletter on LinkedIn. If you want deeper analysis and exclusive content, you can also sign up for the extended version via email.
