Transforming Clinical Trials with R and R Shiny (Part 1/3): Why Clinical Trial Decisions are Slow and What To Do About It

Every day your clinical trial data sits and waits for analysis, you're potentially losing thousands to millions of dollars. You're also delaying life-saving treatments for patients who desperately need them.
Traditional clinical trial analytics pipelines take an average of 120 days to transform raw data into actionable decisions. During this four-month window, critical safety signals go undetected. Go/no-go decisions stall pipeline progression. Regulatory submissions face unnecessary delays.
Here's the financial reality: According to the Tufts Center for the Study of Drug Development, each day a drug gets delayed from market represents approximately $1.1 million to $8 million in lost revenues, depending on the therapeutic area.
The problem isn't data collection - pharmaceutical companies generate massive volumes of information from electronic data capture systems, wearables, lab results, and real-world evidence sources. The real challenge lies in how you convert this data into timely insights that can drive critical business decisions.
In this article, you'll discover exactly where these costly delays come from. You'll see why traditional analytics approaches can't handle today's complex data ecosystem. And you'll learn what opportunities exist to dramatically accelerate your decision timeline.
What does it really take to get R and Shiny applications accepted in FDA submissions? Read our Top 5 Lessons Learned from 5 FDA Pilots
Table of contents
- The Real Cost of Delay
- Why "Data Collection" Isn't the Challenge Anymore
- The Ecosystem Mess: Batch Updates, Lab Data, Questionnaires, and Omics
- Where Time Gets Lost: Data Transfer, Programming Backlogs, Re-validation, and Reviews
- The Opportunity: What's Broken and Ripe for Change
The Real Cost of Delay
When clinical trial decisions drag on for months, the financial impact reaches massive levels. For a top-selling pharmaceutical product, pre-approval delays can cost between $600,000 to $8 million per day in lost revenue opportunity, according to Nature Reviews Drug Discovery.
The Tufts Center for the Study of Drug Development puts this in even starker terms: "Each day a drug gets delayed from the market represents approximately $1.1 million to $8 million in lost revenues, depending on the therapeutic area."
These aren't abstract numbers on a spreadsheet. They represent real value that could be reinvested in new research, expanded patient access programs, or improved clinical outcomes for the people who wait for these treatments.
The impact varies dramatically across development stages, but it's significant throughout the entire pipeline. In early-stage trials, operational costs alone can reach $20,000 to $50,000 per day. You're looking at potential delays of three to six months before you reach critical go/no-go decisions.
Late-stage trials face even higher stakes. Operational costs climb to $70,000 to $150,000 per day - and for potential blockbuster drugs, each day of delay can cost up to $8 million in lost market opportunity.
Here's what's most concerning: each month of delay represents a lost month of market exclusivity. That directly reduces the lifetime value of your asset.
The bottlenecks that create these delays are both predictable and preventable. Safety signal detection that should take 1-2 days stretches to 7-14 days. Dose-finding analyses expand from 3-5 days to 14-21 days. Go/no-go decisions balloon from 7-10 days to 30-45 days.
Why "Data Collection" Isn't the Challenge Anymore
In 2025, pharmaceutical companies are drowning in data, not starving for it.
Electronic data capture systems, mobile health apps, wearables, imaging technologies, and omics analytics generate huge volumes of data every single day.
The infrastructure for data collection has never been more robust. Clinical trial sites capture patient information in real-time. Laboratory results flow in automatically. Digital biomarkers provide continuous streams of physiological data.
But here's the problem: having more data doesn't automatically lead to better decisions.
The average Phase III trial generates 3.7 million data points. Yet it takes 4-6 months to translate this information into actionable insights. Your teams spend 70% of clinical development time waiting for data or data analysis, rather than acting on it.
This creates a painful paradox. You have access to more clinical information than ever before. But your decision timeline has actually gotten slower as data complexity has increased.
The real bottleneck isn't data availability - it's the outdated processes and fragmented systems that stand between raw data and the insights that drive critical business decisions.
The Ecosystem Mess: Batch Updates, Lab Data, Questionnaires, and Omics
Your clinical data doesn't come from a single, well-organized source. Instead, it arrives from a chaotic mix of systems that operate on completely different schedules and formats.
Electronic data capture systems handle up to 70% of your clinical data. They run on daily or weekly batch updates that create immediate delays in your analytics pipeline.
Laboratory data represents another 20% of your information flow. But it typically transfers weekly and often arrives in custom formats that require additional processing time. Patient-reported outcomes come through questionnaires on their own timeline. Meanwhile, imaging data, omics data, biomarkers, and real-world data sources each operate according to their own governance structures and update frequencies.
Each data stream speaks a different technical language. What works for EDC systems doesn't work for lab data. The tools that handle patient questionnaires can't process genomic information.
It's an unstructured mess, to say the least.
The result is a complex ecosystem that's incredibly difficult to navigate. Traditional analytics approaches simply weren't designed to handle this level of diversity and complexity across multiple data sources.
Every handoff between these different systems creates friction that slows down your entire pipeline. Instead of a smooth flow from data collection to decision-making, you end up with a series of bottlenecks where information gets stuck. It waits for the next system to process it.
This fragmentation forces your teams to spend more time on data logistics than extracting meaningful insights from the information you've worked so hard to collect.
Where Time Gets Lost: Data Transfer, Programming Backlogs, Re-validation, and Reviews
The journey from raw data to actionable insights involves multiple handoffs. Each one eats away weeks from your timeline.
Data transfer alone consumes 2-3 weeks as information moves between systems. Formats get converted. Compatibility issues get resolved.
Programming backlogs add another 3-4 weeks to your timeline. Your statistical programming teams face growing queues of analysis requests. These backlogs aren't shrinking-they're getting longer as data complexity increases.
But the programming work is just the beginning. Every analysis must go through validation to ensure accuracy and compliance. This gets followed by detailed documentation that meets regulatory standards.
When issues surface during validation, the re-validation process can add days or weeks to your timeline. Review and revision cycles contribute another 2-3 weeks as stakeholders examine results, request changes, and iterate on findings.
Each handoff between teams, systems, and processes creates additional friction that compounds your delays. A simple analysis request can touch five different teams across multiple departments before it produces a final result.
Here's the cumulative effect: weeks turn into months, and months turn into missed market opportunities. What should be a streamlined process becomes a series of interconnected bottlenecks that systematically slow down every critical decision in your clinical development program.
The Opportunity: What's Broken and Ripe for Change
The current clinical analytics landscape reveals a clear pattern when you map different approaches against business impact and ease of implementation. Traditional statistical programming sits in the lower-left quadrant-high usage but increasingly limited impact as complexity grows.
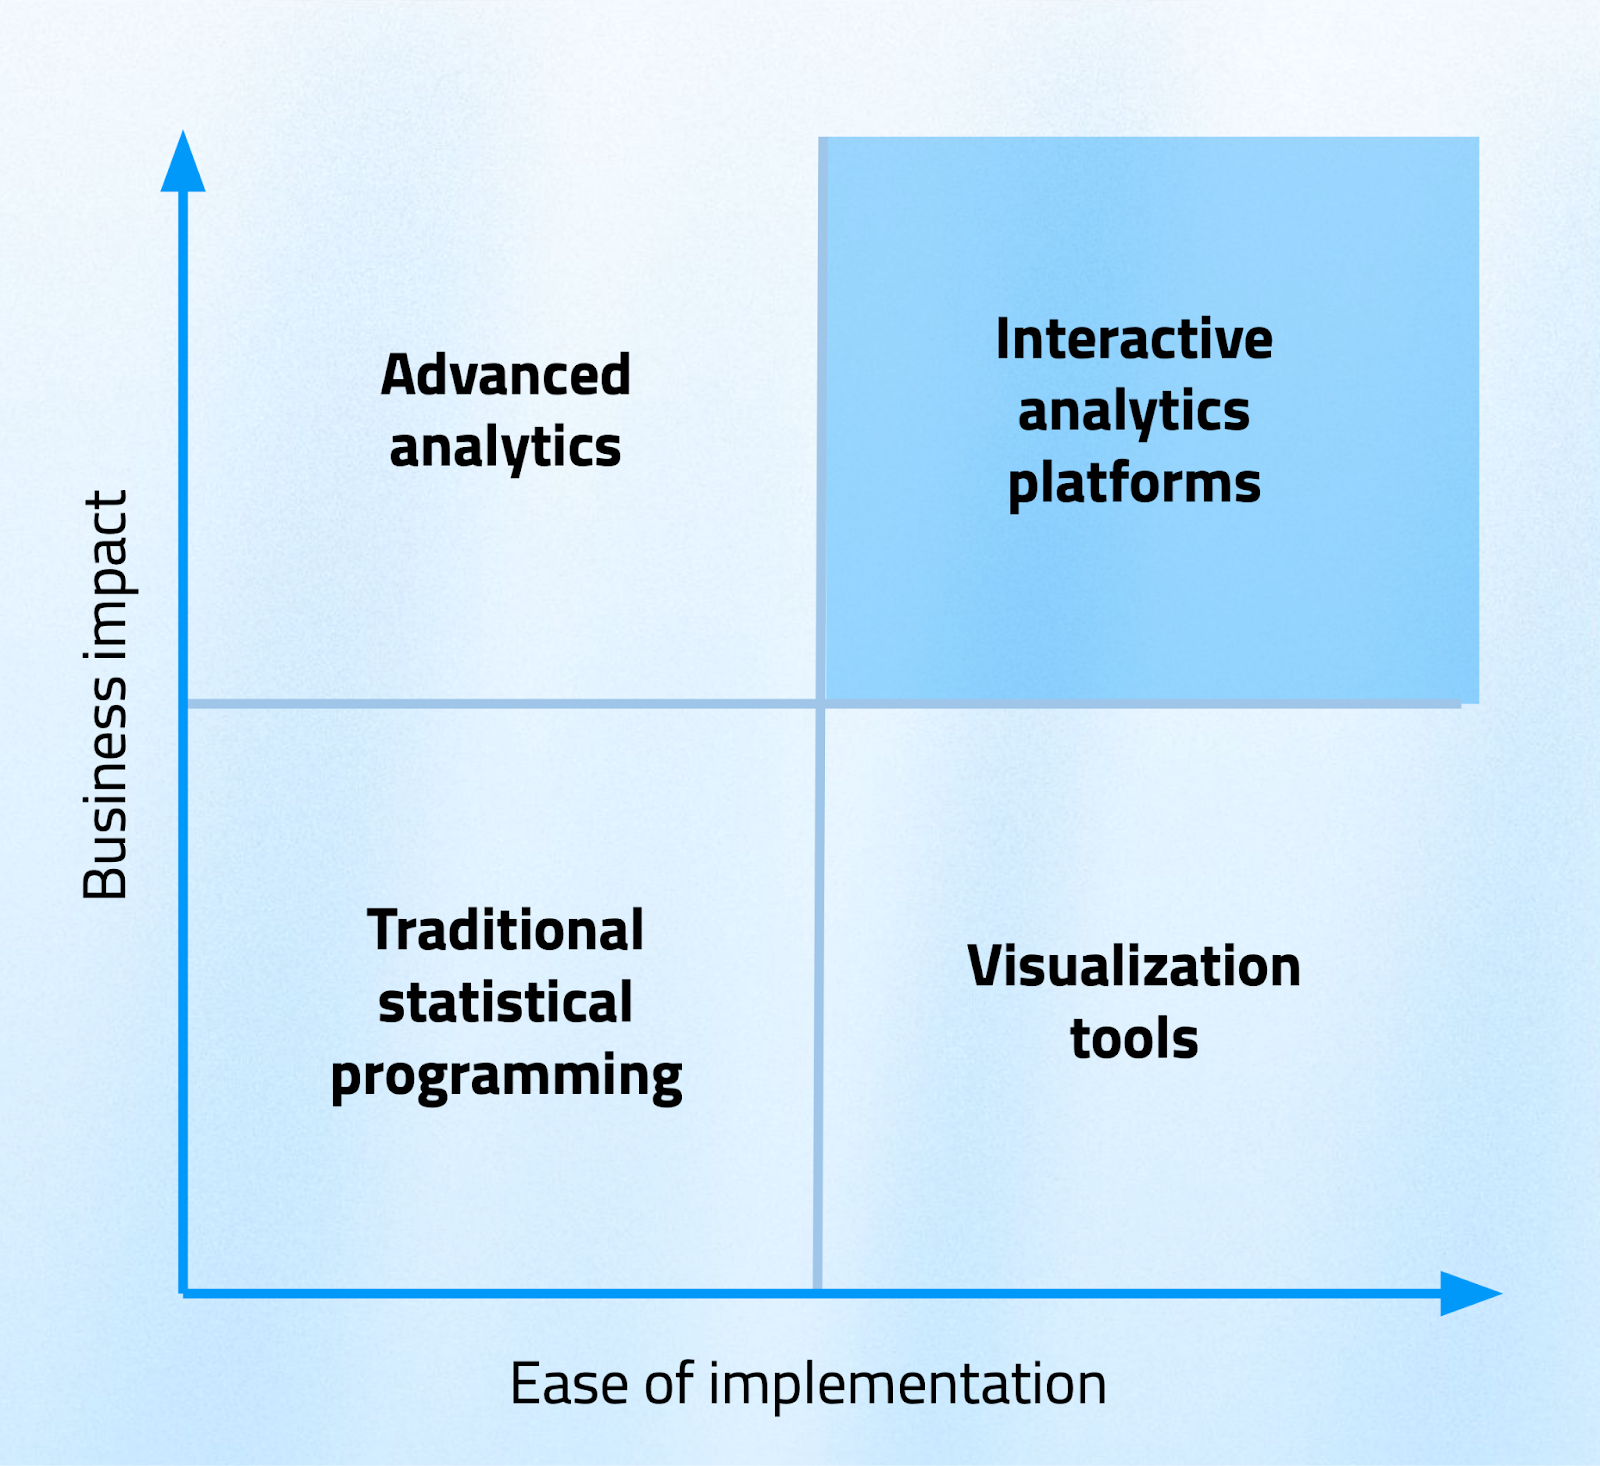
Advanced analytics platforms offer high business impact but often come with difficult implementation challenges that make them impractical for many organizations. Simple visualization tools are easy to implement but provide only moderate impact when you use them in isolation.
The opportunity lies in the upper-right quadrant: interactive analytics platforms that deliver high business impact with moderate implementation complexity.
This sweet spot represents where transformative value gets created today. Companies that successfully occupy this space are seeing dramatic reductions in decision timelines. They're maintaining the quality and compliance standards that regulatory submissions demand.
The technology exists to solve these problems right now. The data infrastructure is already in place. The analytical capabilities are proven and mature.
What's missing is the strategic shift from traditional, static reports to dynamic, interactive analytics that can keep pace with the complexity and velocity of modern clinical trials. The organizations that make this transition first will gain a significant competitive advantage. They'll bring life-saving treatments to market faster.
This transformation is happening - the question is whether your organization will lead it or follow it.
Ready to explore practical solutions to these clinical trial analytics challenges? We've created a comprehensive guide that shows you exactly how R and Shiny are transforming pharmaceutical analytics. Download our free ebook to see real-world case studies and implementation strategies.
For the latest insights on pharmaceutical analytics and digital transformation, subscribe to our Pharma Brief newsletter on LinkedIn. If you want deeper analysis and exclusive content, you can also sign up for the extended version via email.
