What's Your Workflow?: Traceable TFLs From Protocol to Table

Ask anyone in stats programming where a particular number in a table came from, and then watch how long the answer takes to arrive. Usually it involves opening the spec, then the program, then the ADaM dataset, then working backwards to SDTM, and eventually finding the person who wrote it. The answer exists, but it’s distributed across four artefacts and one person’s memory. That distance between a result and its source is where QC cycles go, and it’s also what a regulator is asking about when they ask about traceability.
This is the last post in What’s Your Workflow? and the second of the two entries Appsilon submitted to the CDISC AI Innovation Challenge 2026. Protocol in, TFLs out, with traceability built into the workflow rather than assembled afterwards.
The lineage problem
Traceability is one of those words everybody agrees on and nobody quite implements the same way. In most organisations it means the documentation exists, and that if you follow it carefully enough you can reconstruct the chain.
Reconstruction is manual, it happens late, and it depends on the documentation and the code agreeing with each other. When they disagree, and they do, you find out during QC weeks after the divergence was introduced. Then somebody has to work out which of the two was right in the first place. There’s a second issue underneath that, which is completeness. Even with a perfect chain running from a table back to its source, the harder question is still open. Does every study objective have a deliverable answering it, and is anything missing? That’s a question about the whole study rather than one table, and it usually gets answered by a person reading a TFL shell list against a protocol and hoping they didn’t skip a line.
From protocol to rendered tables
The workflow starts from uploaded USDM metadata and SDTM datasets and produces rendered TFLs along with a full traceability graph, using agents, deterministic scripts, and three human gates.
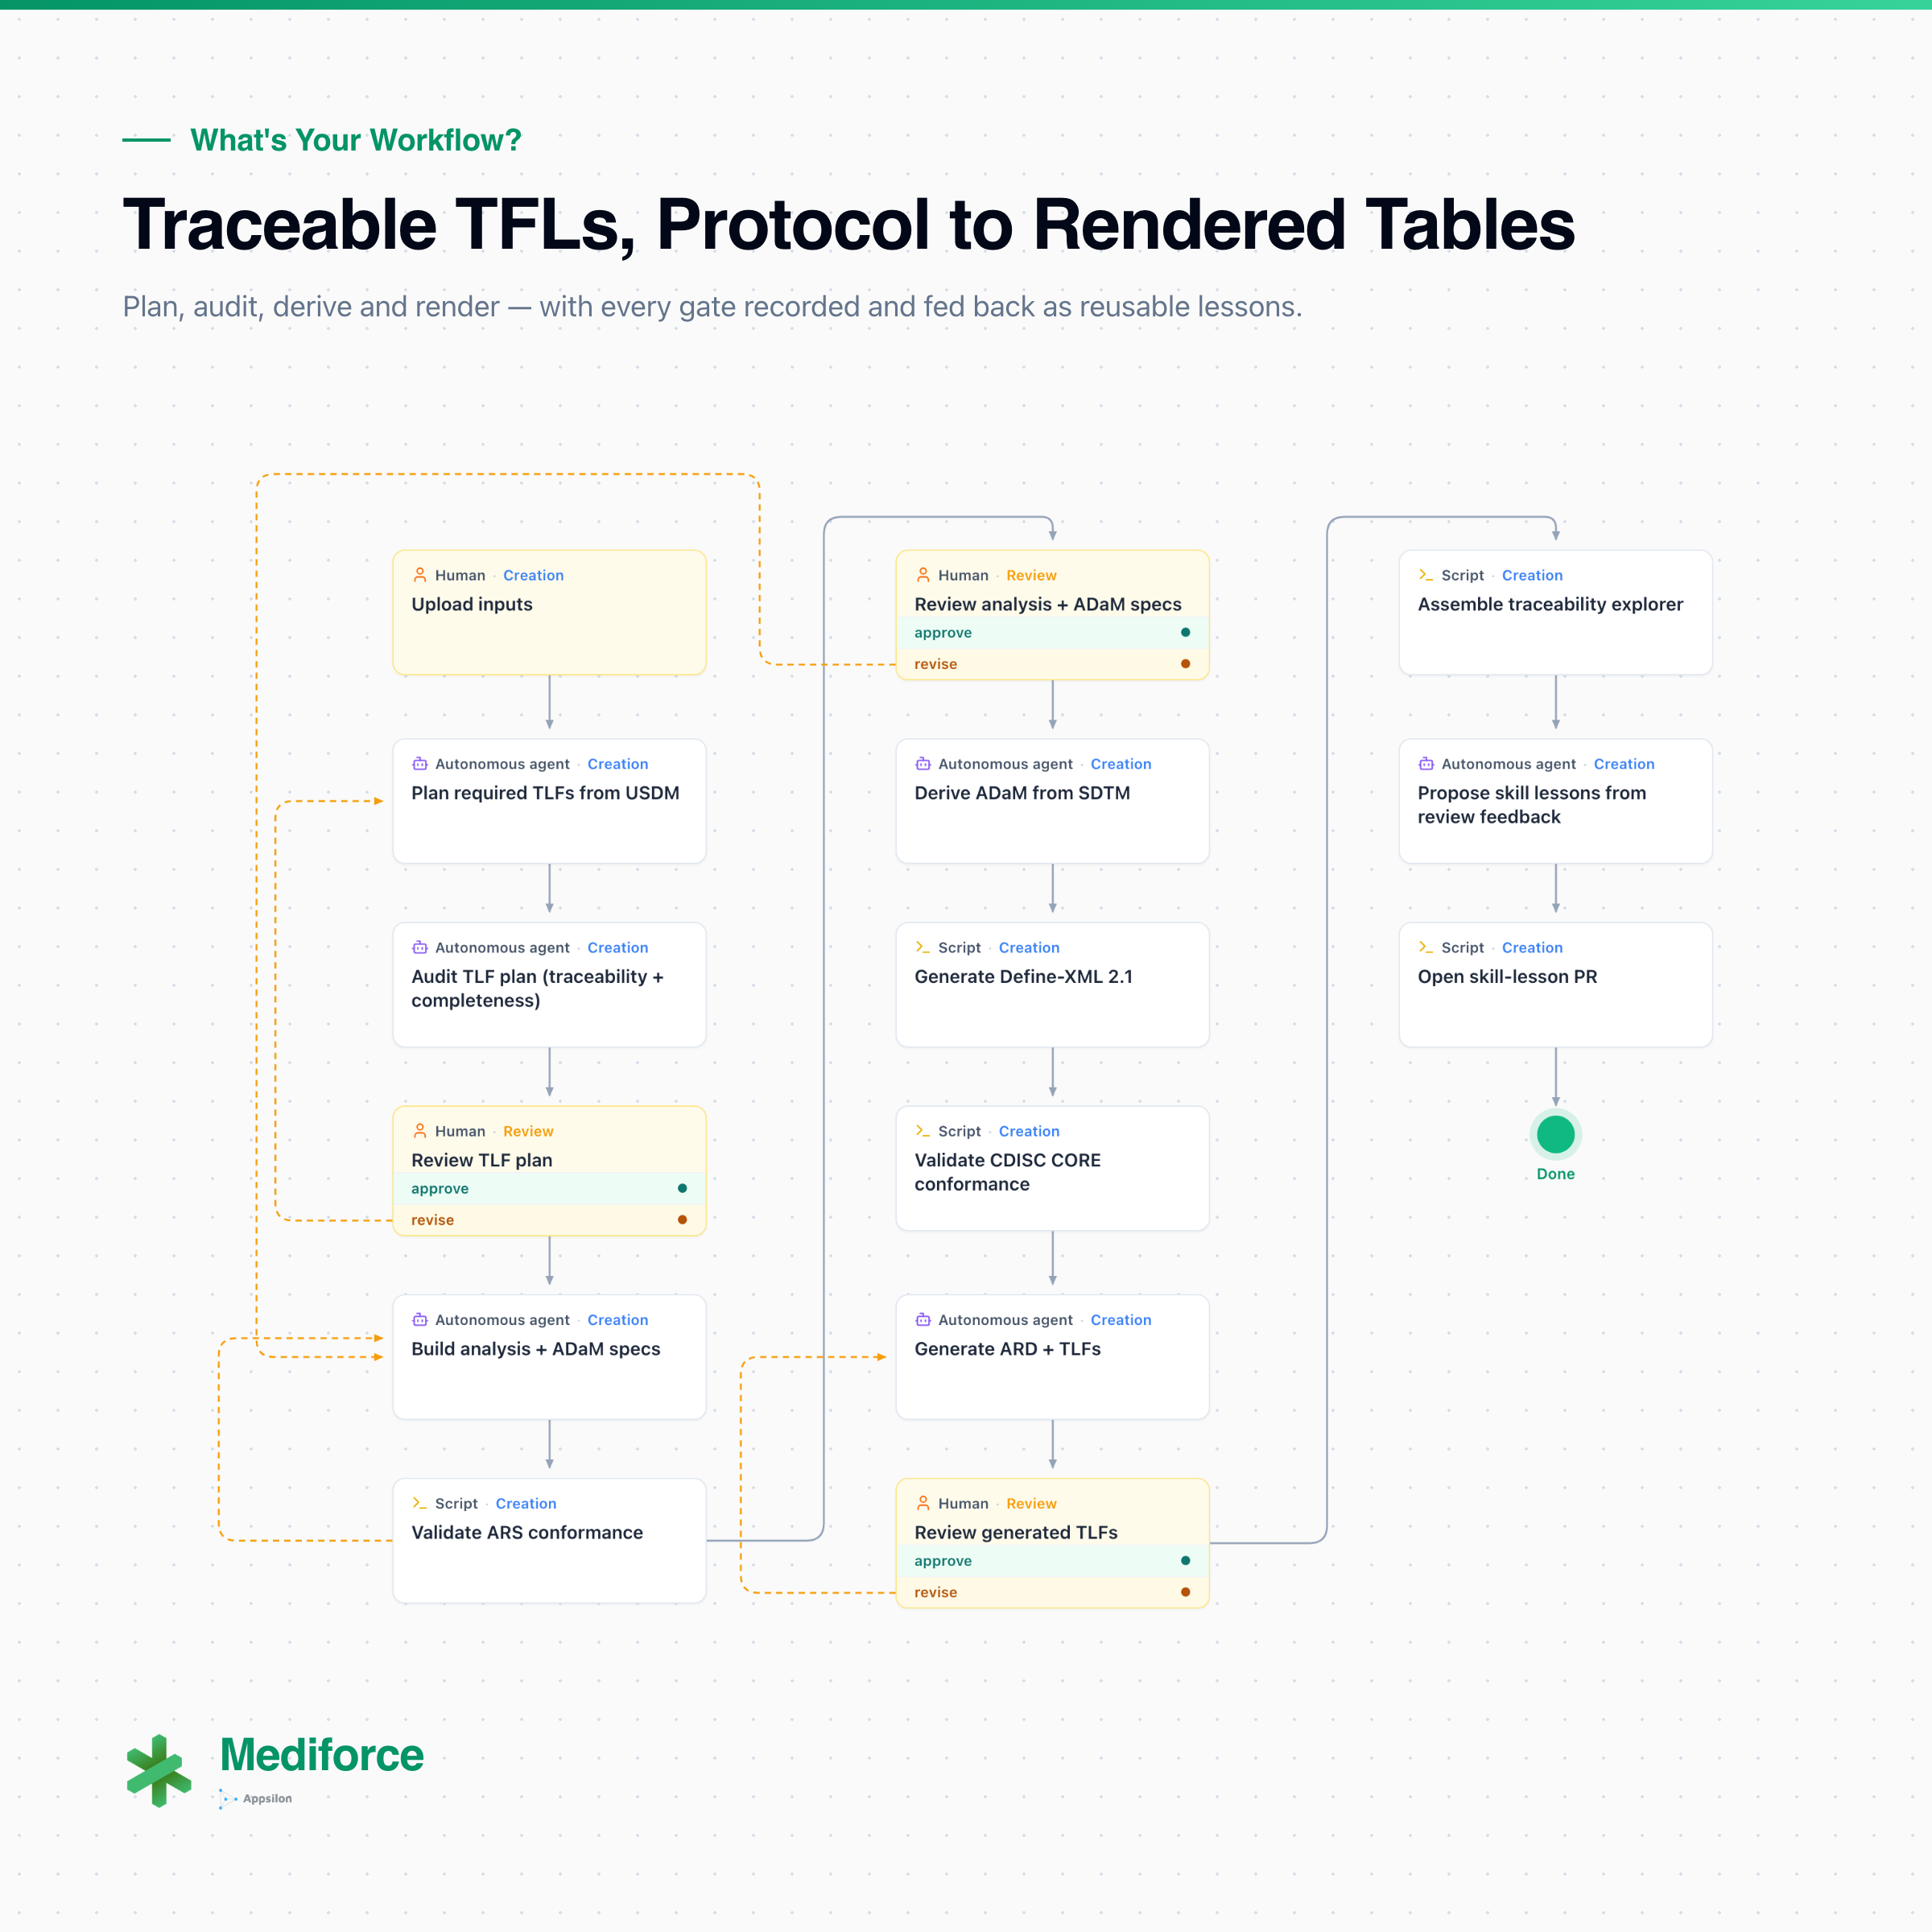
Planning (agent). Working from the USDM metadata, an agent identifies every table, figure, and listing the study is going to require.
Auditing the plan (agent). A second agent independently audits that plan for completeness and traceability, flagging gaps before anybody builds anything. Two agents, separate jobs, one checking the other’s work.
Approving the plan (human). The first gate, where a person confirms the study is going to produce what it needs to produce, before any specs get written.
Specifications (agents). ARS-aligned analysis specifications and ADaM specifications, both derived from the approved plan.
Derivation and conformance (scripts). ADaM datasets get derived from SDTM, Define-XML 2.1 is generated, ARS schema validation runs, and CDISC CORE runs the conformance checks. These are deterministic scripts rather than agents.
Results and rendering (agents). Analysis Results Data, followed by the actual tables, figures, and listings.
Approving the output (human). More gates, and the feedback coming out of them doesn’t simply evaporate afterwards.
Review feedback from the human gates gets distilled into skill lessons and opened as pull requests against the project repository. The workflow improves each run, and every improvement arrives as a reviewed diff rather than a silent change in behaviour.
What actually gets recorded
Every run keeps two separate records. The step log covers the agentic work itself, meaning every tool call an agent made, in order. It exists for the person trying to debug why a step did something strange. The audit log is a regulated record of who did what and when, holding the exact input and output snapshot for each event. Its schema follows ALCOA+, so the record is structured for inspection rather than something you’d reformat afterwards.
It’s tempting to run one log for both purposes, but the requirements pull in opposite directions: too noisy for an inspection, too sparse for debugging.
The mismatch the explorer catches
The output includes an interactive explorer that answers the regulatory question for the whole study: what each deliverable traces back to, and what’s missing.
It starts from the objectives and endpoints generated out of the USDM standard. From there it connects each endpoint to the TFLs answering it, each TFL to the ADaM datasets producing it, and each ADaM dataset to the upstream SDTM domains it draws from. Click a table and you get the rendered output, the ARD, and the code that generated it. Click a dataset and you get its variables, and click an objective and you get its overview. Where something needs clarification or is missing outright, it gets flagged explicitly rather than being an absence you’re expected to notice on your own. There’s also a second view built for programmers rather than reviewers, called ADaM variable lineage. You pick any ADaM variable and get the full chain on screen. The SDTM columns and upstream ADaM variables feeding it, the R code that builds it, and the downstream variables and TFLs consuming it.
Two examples from the demo show why this ends up being more than a nicer-looking diagram. The first is baseline BMI, where the explorer shows it computed from baseline weight and height. Follow those up and they turn out not to be SDTM columns at all. A pivot_wider promoted VSTESTCD values into columns, and the explorer catches that transformation instead of losing the thread at the pivot, which is easy for a conventional lineage view to drop. The second is treatment end date, where the spec derives it from the exposure domain by taking the last exposure date, while the program reads it straight from the demography domain and never touches exposure at all. The explorer compares the code against the spec and surfaces the divergence. A spec-versus-code mismatch on a derived date is exactly the sort of finding that turns up in a QC cycle weeks later, costs a rework loop, and generates an uncomfortable conversation about how long it had been sitting there. Here it surfaces as part of the run that produced it.
Why the second agent exists
This workflow does something the other three don’t, which is put an agent into a checking role.
The planning agent works out which TFLs the study needs, and instead of that plan going straight to a person, it goes to a second agent that audits it for completeness and traceability. Both steps run under human review, so nothing advances until the reviewer approves, but the reviewer now gets the plan with the likely gaps already circled. The pattern has limits. An independent audit agent catches one class of error cheaply, meaning omissions, traceability gaps, and the sort of thing a planner working forward wouldn’t notice it had skipped. It doesn’t replace the human gate and it doesn’t try to. Three human review gates sit where the cost of being wrong is highest: after the plan, after the specs and derived data, and after the rendered output. The derivation, Define-XML generation, and conformance steps in between run with no agent at all.
Traceability as a working tool
The direct saving is in QC. Finding a spec-code divergence during the run rather than during QC removes a rework loop, and multiplied across a study’s worth of derived variables that adds up.
The larger change is in what traceability can be used for. At the moment it’s a deliverable, meaning something produced for an inspection, assembled out of artefacts, and correct as of the day somebody assembled it. Making it a by-product of the pipeline changes what it can be used for. If the chain running from objective to endpoint to TFL to ADaM to SDTM is live and queryable, it stops being an inspection artefact and starts being a working tool. You can use it to answer what breaks if you change a derivation, or which deliverables a given SDTM domain feeds, or whether anything in the protocol is going unanswered. Those are questions a programming lead has most weeks and currently answers by asking around the office.
Review comments in most organisations are corrections applied to one deliverable and then forgotten. Capturing them as reusable lessons opened as pull requests means a reviewer’s judgment gets applied to future runs instead of being spent once and lost.
What this means for your workflows
Across these four posts the same shape keeps turning up, and that’s the shape to take from the series. Scripts handle the deterministic work, agents read and interpret and plan and draft, and humans decide at the points where being wrong is expensive and hard to reverse. Every step logs what it did, and improvements arrive as reviewed diffs. None of that is specific to TFLs. It’s specific to regulated work, where you have to be able to explain afterwards what the system did and show the record for it.
We think a platform for creating and managing workflows like these can drive AI adoption without compromising the quality of the output, and that’s the bet Mediforce is making. It’s open source under Apache 2.0, so you can check our work.
That’s the series. Four workflows, four different splits between agents, scripts, and people, and one consistent principle sitting behind all of them.
Related reading
The rest of What’s Your Workflow?:
- The Landing Zone for CRO Data Deliveries
- The Submission Document Chase That Runs Itself
- Synthetic SDTM From an NCT ID
- Traceable TFLs From Protocol to Table (you are here)
Before this series I wrote a run of posts working through the AI concepts these workflows rely on. If any of the terminology here was new, start at the top:
- What Is an AI Agent? Skills, MCP, and Harnesses Explained
- The Four Ways to Use AI: Chatbots, Apps, Agents, and Workspaces
- How to Get Useful Answers from AI: Prompting and Context
- What Is RAG? How AI Answers From Your Own Documents
- The Four Levels of AI Autonomy: Observer, Advisor, Drafter, Executor
- Human-in-the-Loop AI: Oversight a Regulator Accepts
And on the platform itself:
- Introducing Mediforce v1.0.0: AI-in-the-Lead Workflows for Pharma
- Mediforce x Databricks: Human-in-the-Lead AI Workflows While Your Data Stays in Databricks
Book a live walkthrough. Bring your study setup along and we’ll show you how these workflows map onto it. Thirty minutes, with the people who built it.
